AVL Simulation Software Release 2024 R2
- Blog
We are proud to present our latest software Release 2024 R2.
Our team of experts worked tiredlessly to develop unique solutions – customer challenges and feedback were taken into account in this new software release. The result is impressive – below you have the opportunity to take a detailed look at the new features per topic.







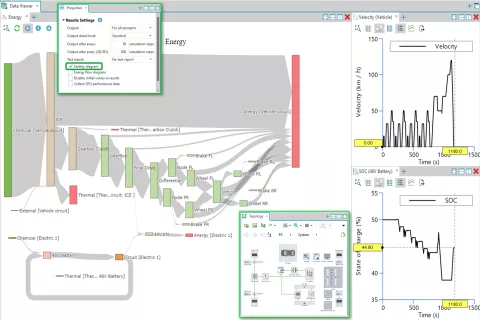
Sankey Diagram – Efficient System Analysis
While the analysis of component KPIs is straightforward, network analysis can quickly become complex. To address this complexity, this version of AVL CRUISE™ M introduces Sankey diagrams, a well-established visualization technique where fluxes between components are represented by arrows scaled to the flow rate of the transported property. Creating Sankey diagrams is as simple as selecting a check box in CRUISE M's output settings. The results comprise power (i.e. power flux) and energy (i.e. time integrated power flux) as these are universally shared quantities across all domains. The Sankey plot offers a spectrum of functionalities to customize it according to your needs. If a diagram becomes too crowded, you can choose a different grouping either by introducing subsystems upfront in your model, or by deactivating the visualization of certain physical domains. Once a Sankey diagram meets your needs, you can apply one of the export functionalities and incorporate it into any of your reports.

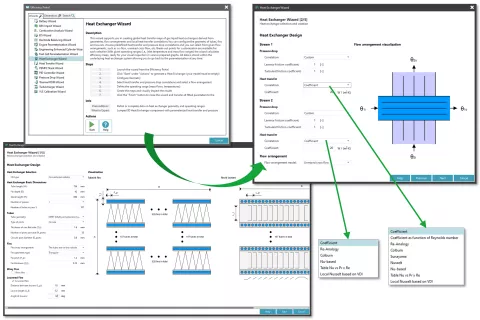
Conventional Radiator – Heat Exchanger Wizard
Pre-dimensioning of heat exchangers according to requirements and operating points is an essential task for simulation engineers, and indirectly, for the tools they use. The CRUISE M Heat Exchanger Wizard guides you through the dimensioning of all essential geometries, the configuration of flow arrangements and through a selection of different heat transfer and pressure drop correlations to create a ready to run heat exchanger model. With this version of CRUISE M, the inputs requested by the wizard are further specialized to align with typically available specification sheets of conventional radiators. When selecting the new check box “Evaluation mode”, you can configure a list of operating points that will be automatically transferred into different simulation cases when clicking the “finish button” to create the heat exchanger model. When simulating the case from the evaluation mode, you get results like those given on the wizard's preview page, underlining the consistency of the workflow.

Refrigerant Circuits – Stability of Deactivated Branches
The behavior of refrigerant circuits is often simulated exclusively by looking at either the heating or cooling mode, where only the relevant branches for the considered mode are modeled. Depending on the mode, branches will be activated and deactivated. This version of CRUISE M tackles the problem more rigorously, directly at the solver level. When you equip a branch with valves on either side, CRUISE M checks for their closure. If the valves are closed, it freezes the states of the trapped refrigerant and shuts off any heat transfers to connected walls, coolant, or gas path circuits. This guarantees that the remaining active parts of the circuit work without any disturbances, featuring even higher computational speed due to a reduced, right sized circuit.


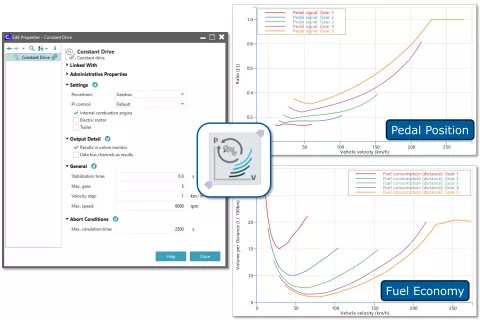
Constant Drive – Vehicle Performance Assessment
A common approach to assess the characteristics of a vehicle and its powertrain configuration is to run it at a constant velocity in different gears. Using simulation to get this information early in the development process helps shape essential drivability targets. To streamline the setup of such simulations, CRUISE M introduces a new Constant Drive Component that bundles all required inputs and takes care of running the task. Constant drive simulations in CRUISE M are not restricted to certain basic powertrain configurations; they can be run for BEV, HEV or any other layout you might wish to analyze.

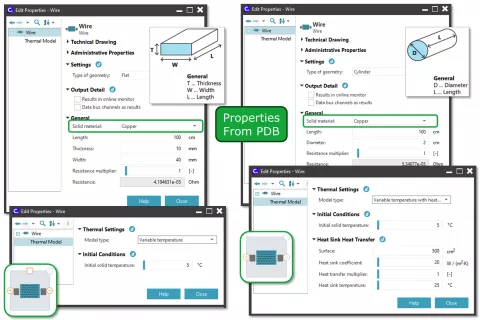
Wire – Ohmic Losses Calculated from Material Properties
Electrical components like batteries and e-motors are integrated into networks of electrical connections that contribute to certain Ohmic losses. Resistor components are often used to consider these losses, representing the impact of busbars or wires. This version of CRUISE M simplifies the calculation of Ohmic losses by introducing a Wire component. Within this component, you need to specify its geometry and select a material from CRUISE M's material database. With that, the corresponding Ohmic resistance is calculated, also considering temperature dependent electric conductivity, if provided.

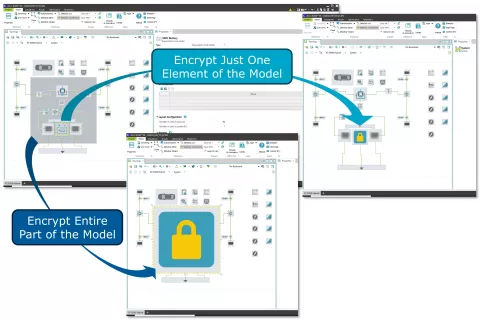
Encrypted Subsystem – Custom Model Protection
When modeling engineers collaborate on models, there are often different levels of information that should be shared. This version of CRUISE M offers the possibility to partially protect a model. Selected subsystems can be hidden while keeping the rest of the model fully accessible. You move the model components you wish to protect into a subsystem, select "encrypt subsystem" from the context menu, type a password and that is it. If you want to expose certain parameters, you can combine CRUISE M's subsystem masking with the new encrypting functionality.

AVL CRUISE™ M Gas Path Numeric
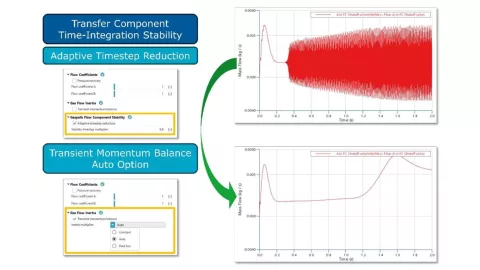
With the previous release of AVL CRUISE™ M a dedicated, log-file-based guidance to monitor and influence the contributions of various gas path components (e.g. throttle, restriction, compressor, turbine) to the numerical stability of a complete gas path model. The information can be used to manually adapt the model parameterization in two areas, by changing the time step or by modifying the inertia multiplier of the transient momentum balance.
With the 2024 R2 version of CRUISE M, the software itself interprets the extracted information and, if necessary, takes measures to maintain high stability of the simulation. The user only selects his preferred option for corrective measures. He can opt for an adaptive time-step reduction or choose the auto option for the input of the inertia multiplier.
CRUISE M 2024 R2 then monitors the model with respect to given stability criteria and changes (increases and/or decreases) the time step or the inertia multipliers of critical components. A comparison of measured real-time factors revealed that changing time steps clearly influences the computational performance, while online adjusted inertia multipliers show no significant impact.

AVL CRUISE™ M Thermodynamics Enhancements
With CRUISE M 2024 R2 several enhancements are introduced to extend modelling capabilities and performance of thermodynamic cycle simulations. These include:
- A leakage model for plenums, which enables to optionally model leakage effects directly in the plenum, requiring inputs for leakage cross-section, ambient pressure and flow coefficient
- Improved simulation speed of the charger component featuring a "Full model with performance maps"
- Alignment of the NOx Emission calculation in mean-value and crank angle-resolved engine models
- Introduction of data bus channels for
- Start and end of injection, in cases where the injection profile is given as an input table or calculated
- Cycle-averaged static plenum pressure and mean total pressure in pipes
- Mach number output for the components restriction and throttle
- A new input for “Map of tables”. When choosing the input option "Rate of x table", the user now can change the domain axis from engine stroke to time
- Using mass flow weighted inputs of combustion products and fuel burned fractions for the lambda value given at measuring points of the gas flow pipe. This provides a more representative value for the actual lambda in the exhaust system.
AVL FIRE™ M Combustion and Emissions Modelling
Regarding combustion and emission modelling the focus of the AVL FIRE™ M 2024 R2 development was put on providing extensions of the ECFM-3Z model, further improving its applicability to model new fuel combustion systems. These extensions include:
- Enabling the ECFM-3Z model to handle fuel mixtures of hydrocarbon fuels and non-hydrocarbon fuels. This extension is applicable to simulate diesel-ignited hydrogen engines. For diesel/ammonia mixtures the feature is still undergoing enhancements.


Furthermore, FIRE M 2024 R2 offers the following extensions in regard to combustion/emission modelling for ICEs:
- The general gas phase reactions code was extended with a calibration factor for the reaction rate. The parameter value can be set in the GUI. This factor allows for better calibration of simulations.
- The adaptive mesh refinement feature has been extended to work on basis of specified species mass fractions.
Support for Layers in AVL EXCITE™ M
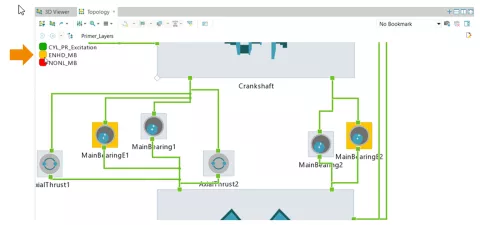
The generation of diverse model configurations and the variation of these configurations through simulation cases can now be achieved with minimal effort using layers. Layers enable deactivation of specific model components for the purpose of visualization, activation or deactivation of model parts and switching between different joint variants (simple/complex) The elements that can be placed into layers include bodies, joints, assemblies, loads, sensors, functions, and so forth.
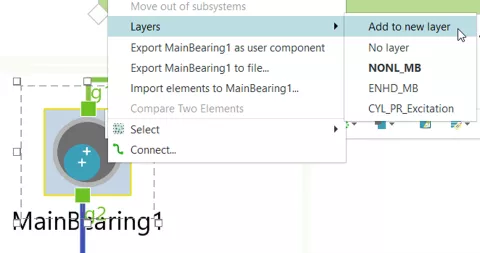

Both the Topology Editor and the 3D Viewer supports layers, by showing or hiding parts depending on their activation in the layer configuration. The activation and visibility of individual layers can be adjusted within a layer configurations panel.

Rolling Element Bearing Catalog
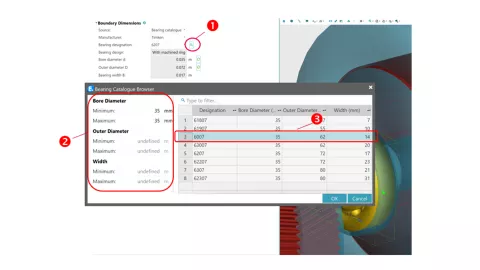
Rolling element bearings are standardized components commonly specified through manufacturer catalogs. EXCITE M introduces a catalog function for bearing selection based on designation, such as "6205" for a deep groove ball bearing with a 25 mm inner diameter.
Once selected, the bearing's installation geometry is automatically incorporated into linked shaft and housing seat dimensions. While detailed internal bearing geometry and the number of rolling elements is not part of the catalog, EXCITE M estimates it by using static and dynamic load ratings (ISO 96 and ISO 281). Currently bearings from SKF and Timken are included.

Bearing Lifetime Calculation
Bearing life, critical for drivetrain durability is affected by factors such as loading conditions, geometry, lubricant aging, contaminants and ring tilting.
A new Bearing Lifetime Calculation App calculates bearing life (ISO 281 and advanced ISO/TS 16281) for all roller bearing types supported in EXCITE M. The app is an interface between EXCITE M models and FVA-Workbench. Bearing properties and case results are obtained from the EXCITE M model, and additional user input for lifetime specific geometry, lubricant and service life attributes can be specified within the app.
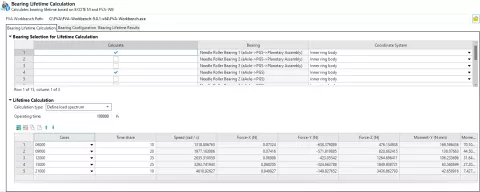

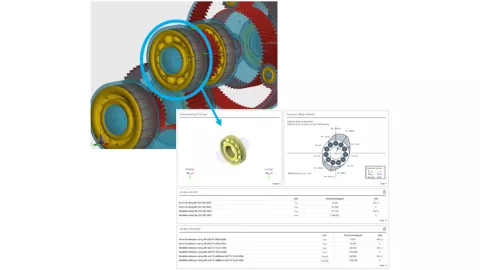
Individual cases or selected multiple cases can be calculated to determine the accumulated lifetime based on time share for each case. The app shows lifetime results and produces an HTML report for each bearing and calculation type. This includes the data used for the calculation, force distribution, Hertzian contact stresses and additional rating life values.
Note: This feature is based on the bearing lifetime calculation capabilities of the FVA-Workbench 9.0 or later.

Contour Contact Joint
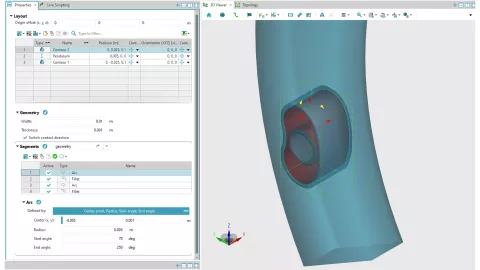
Contour Contact joint, now available in EXCITE M, allows to simulate the contact of contour shapes in a single node to node coupling. The 2D contours are represented with a set of parametric curves as used for pendulum dampers, cam shapes and even cycloidal gear shapes. In the example, using the contour body subcomponents, a pendulum shape is added to a body using a simple set of segments, which can be made up of arcs, fillets, splines and lines.

Consideration of Buttressing Effects in Gears (ACYG)
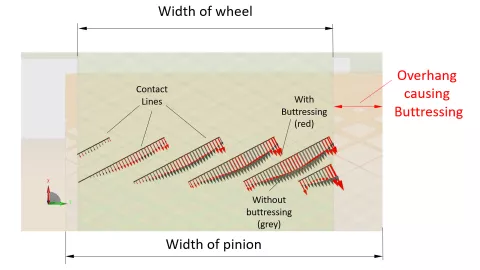
In some cases, the width of the pinion may be significantly larger than that of the gear wheel. The non-loaded region of the wider gear wheel provides additional support to the flank contact and consequently raises contact forces/pressure locally near the ends of the common width. This effect is known as buttressing.
A plate model is introduced in Advanced Cylindrical Gear Joint (ACYG) to account for the interaction between force application points across the flank surface and along the contact line. This model, applied independently to each flank pair of both pinion and gear, considers the effects of different tooth widths.
The illustration of the contact load distribution at the individual flank pairs shows with the gray arrows the results without consideration of buttressing, while the red arrows demonstrate the impact of buttressing on force intensity. It is evident that the overhang width of the pinion results in an increase in contact forces at the end face of the common width, as well as to a lesser extent, at the start/end of the individual contact lines.

Hypoid Gear Joint (SHYP)
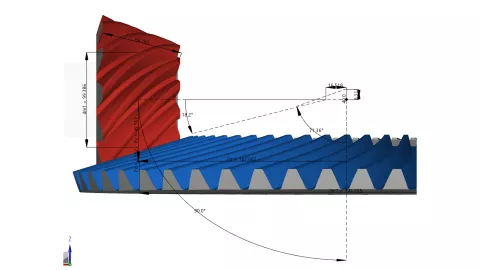
The Hypoid Gear Joint in EXCITE M now includes enhanced geometry checks to reduce high moment drifts. An expanded focus view provides contact point coordinates and cone apex beyond the crossing point, offering information for a deeper understanding of the gear system.

EHD Joints for Predefined PGS Assemblies
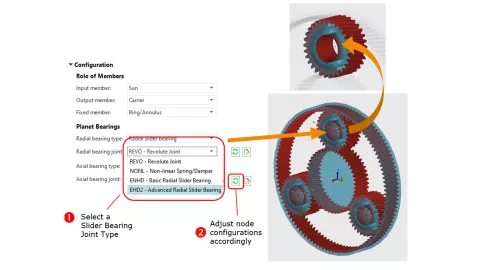
Many industries, including wind turbines and jet engine fan drives, are adopting slider bearings in planetary gearsets. EXCITE M now supports elasto-hydrodynamic slider bearings within PGS assemblies to reflect this trend.
Various elasto-hydrodynamic bearing types (ENHD, EHD2, AXHD) can be used for planet bearings. Switching to slider bearings automatically creates necessary link locations.

Piston/Conrod Analysis Assembly
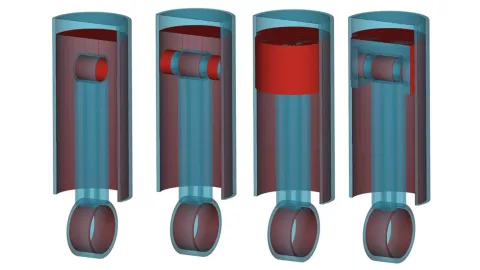
Configuring a full internal combustion engine assembly often requires data unnecessary for focused analyses on conrod bearings, conrod stresses or the piston liner contact. The Piston/Conrod Analysis Assembly offers adaptable topologies:
- Conrod-only: Piston and piston pin inertia are replaced by a virtual force, and related joints are removed. Cylinder pressure is applied to small end nodes.
- Conrod and piston pin: Piston inertia is replaced by a virtual force, and the joints connecting the piston pin to the piston are removed. Cylinder pressure acts on piston pin nodes.
- Combined piston and piston pin: Piston pin is merged, and related joints removed. The connecting rod connects to a new pin on the combined body.
- Full model: Conrod, piston pin and piston are modeled as standard EXCITE M bodies.

New Equivalent Radiated Power (ERP) Results
The calculation of an ERP is a frequently utilized criterion for assessing powertrain NVH. The Internal Data Recovery app now enables the evaluation of ERP for selected surface patches.
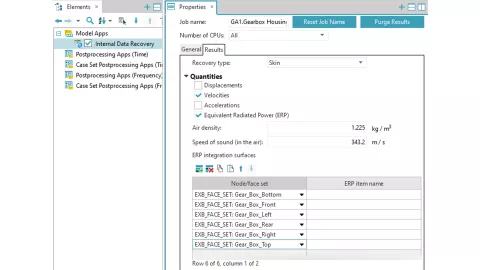

You can easily select ERP calculation in the app's results tab and specify the required parameters. ERP results are stored in HDF5 format and accessible in AVL IMPRESS™ M under the '3D Recovery' node. Both linear and level amplitudes are provided for each surface.
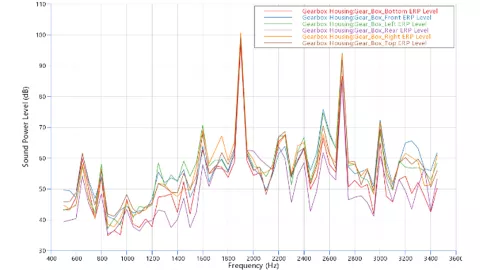

To analyze ERP variations the app supports result comparison across different case parameters (e.g. speed) when placed in a Case Set folder. Visualizations include ERP fringe plots and aggregated results (order or frequency) as 2D surface plots in IMPRESS M.
In order to precisely understand the processes within the battery and to be able to correctly assess the influences on ageing, a large number of new features have been included in this latest release. Find out about the highlights in our battery solution area.
Electrochemical Battery – Breathing and Swelling
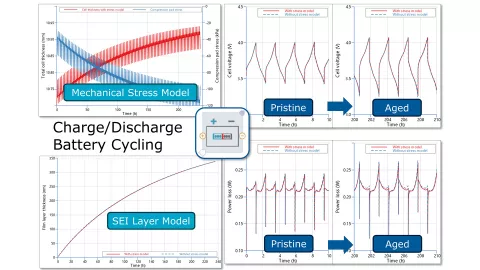
During charging and discharging the cathode and the anode volume change when lithium gets intercalated. The interaction between mechanical stress triggered by the volume changes and the electrical processes within the cell can now be investigated with the latest version of CRUISE M. The SEI formation influences the mechanical stress model and thus the volume change, also known as cell breathing. On the other hand, mechanical stress influences SEI formation by modified transfer resistances.
The combined modeling approach allows a deeper insight into the electrodes and provides information about the areas that are most sensitive to mechanical stresses, changes in porosity or other changes in the internal cell state.

Electrochemical Battery – Loss of Active Material (LAM)
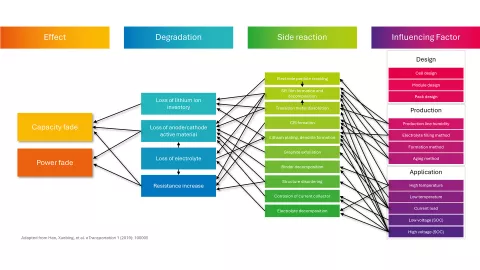

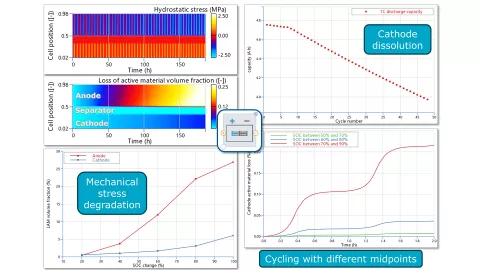
Batteries degrade because the inventory of cyclable lithium gets lost (Loss of Lithium Inventory or LLI) due to parasitic reactions like SEI formation and lithium plating. The active material gets lost (Loss of Active Material or LAM) due to particle cracking or dissolution effects. LLI has been supported by CRUISE M's Electrochemical Battery component for several releases. With this release, LAM is additionally considered.
The mechanical degradation model calculates, based on the simulated mechanical stresses the share of particles that lose contact and become inactive. The model shows how different cell charging/discharging strategies influence the mechanical stresses and consequently LAM. The influence of operating the cell at the upper SoC limit on the cathode resolution can now be investigated.

Electrochemical Battery – Right‑Sized Thermal Cell Model
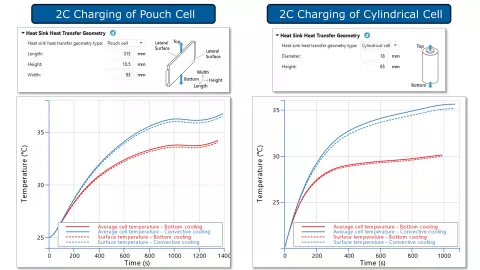
With battery cells, it is not only important to be able to precisely determine their electrical, but also their thermal behavior. The ever-increasing charging and discharging currents lead to cell temperatures that causally interact with the cell chemistry.
With this release, CRUISE M's electrochemical battery component facilitates this kind of simulation studies by upscaling its existing thermal model from the unit cell level to the scale of a complete pouch, prismatic or cylindrical cell. The new thermal model provides dedicated cell surface temperatures to accurately predict external heat transfers. This also includes the impact of anisotropic inner cell properties on internal heat transfers and the consideration of different temperatures for the top/bottom versus circumferential/lateral cell surfaces.

Electrochemical Battery – Low Temperature Stability
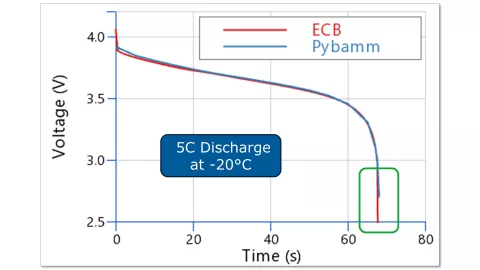
Modeling lithium ion batteries with electrochemical models is a demanding task from many perspectives. A well known challenge is the operation of a virtual battery at low temperatures, high currents and low SoCs. This version of CRUISE M's Electrochemical Battery component has enhanced its numerical procedures based on a thorough root cause analysis of all underlying electrochemical and transport effects.
CRUISE M's virtual cells thus help looking beyond the typical cut-off voltages that would be applied to real cells.

Battery Thermal Analysis in AVL FIRE™ M
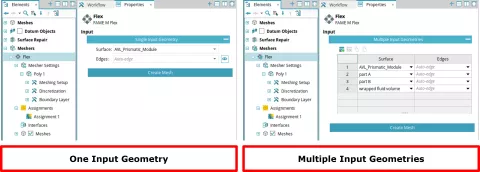
With the release of 2024 R1, a new meshing solution was introduced, a game-changer when it comes to tackling challenges in preprocessing. The new version of FIRE M introduces another important innovation that significantly speeds up day-to-day work with large battery packs.
FIRE M no longer requires to provide a single input surface mesh. Instead the geometry description can now consist of multiple surfaces. Even the most complex and large geometries can now be divided into small and easy to handle parts of the overall geometry.
Together with the possibility to flexibly connect components either conform or non-conform and to distribute the components to individual processors, further considerable reductions in project turnaround time has been achieved.

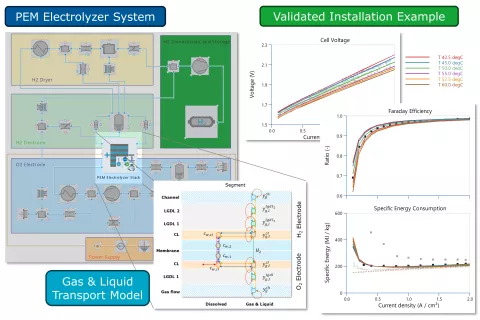
PEM Electrolyzer
AVL CRUISE™ M offers a new component to model proton exchange membrane (PEM) electrolyzer stacks for application in system simulation models to support e.g. the plant configuration, BoP component sizing, dynamic response optimization, etc. of PEM electrolyzers.
The stack model considers gas and liquid transport in the channels, including possible phase changes, molar and Knudsen diffusion through the gas diffusion layers and capillary transport of liquid water from the channels to the catalyst layers.
In the catalyst layers the electrochemical reactions, in the membrane the effects of ionomer diffusion, electro-osmotic drag and hydraulic drag are modeled. A dedicated reactant crossover model describes the transport of hydrogen through the membrane to the oxygen anode. The model has been validated based on reference data and results from FIRE M's anode and cathode feed system, where cell voltages, outlet temperatures and polarization curves are compared for different operating conditions.

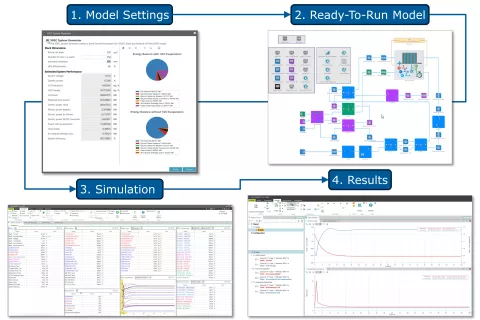
SOEC System Generator
Generators that support the automatic creation of complex models from a few performance parameters are integral to CRUISE M. With this version, the existing library is extended by another generator. This new addition supports the setup of a Solid Oxide Electrolyzer Cell (SOEC) Stack and Balance of Plant (BoP) model from two stack inputs, along with some additional information regarding BoP insulation and heat exchanger effectiveness. Based on your input KPIs, you will receive initial estimates on the expected system voltage, current and efficiency. This includes a visual representation of how the given electrical energy is divided between hydrogen and losses. Upon clicking the Finish button, you will receive a detailed BoP model featuring blowers, heat exchangers, as well as monitors and controls to operate the complete system. The generated model, which includes estimated component parameters, is ready to run and offers a dedicated simulation dashboard for easy operation of the model and for simulation results analysis.

Alkaline Electrolyzer with Porous Electrodes
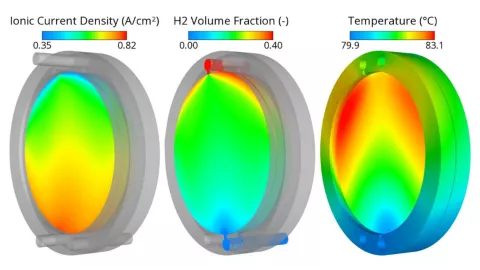
The AVL FIRE™ M fuel cell module has been extended to support the design and optimization of alkaline electrolyzer cells and stacks with regards to, e.g. improved gas bubble removal, increased heat dissipation, reduced overpotentials, etc.
An alkaline electrolyzer is operated with a highly concentrated electrolyte solution, e.g. potassium hydroxide. Thanks to the alkaline environment, non-noble materials such as iron or nickel can be used as catalysts. The electrodes are separated by an ion-conducting porous diaphragm preventing electron and gas crossover, thereby allowing for high power densities.
The alkaline electrolyzer model in FIRE M features the following transport mechanisms:
- Ion transport in the liquid electrolyte (convection, diffusion and migration)
- Ionic charge transport in the liquid electrolyte
- Electronic charge transport in the electrodes, porous transport layer and bipolar plates
- Liquid electrolyte transport in the separator, electrodes, porous transport layers and flow channels
- Dissolved gas species transport in the liquid electrolyte
- Gas species transport in the electrodes, porous transport layers and flow channels
- Heat transport in all regions
FIRE M supports flexible geometrical setup of alkaline electrolyzers, i.e. gaps between the electrode and separator are possible as well as configurations with channels directly touching the electrodes.

Our mission is to provide scalable and cost-effective virtual testing for Assisted Driving (ADAS) and Automated Driving (AD) software. Our new release includes many under-the-hood improvements that increase the throughput of tests per time. Fast functional test feedback is crucial to boost development cycles and reduce the overall time to market. The higher the test throughput, the faster developers and validation engineers receive the feedback of their test campaigns. For developers, the tests are executed automatically as part of the CI/CD pipeline for each committed code change. Validation engineers create parameter variations to thoroughly test a release candidate. Of course, a higher test coverage ensures quality and safety.
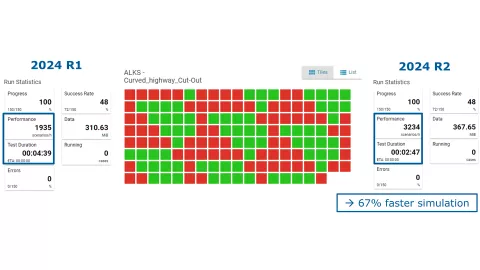

The picture above shows the Cut-Out scenario variation of the Automated Lane Keeping System (ALKS) installation example. The simulations were run in the old 2024 R1 and new 2024 R2 release on the same machine (i5-11500H 6-core CPU, 32GB RAM) with a measured performance increase of 67%. Running 150 test cases took almost 5 minutes with 2024 R1 and now with 2024 R2 the same number of tests can be executed in under 3 minutes. You can do your own benchmark with the free version of the tool and see how your local hardware performs.
Click here to request the FREE version of Scenario Simulator
New: Real Time Visualization of Parameter Variation Results
When running hundreds or thousands of test variants, efficient and automated result analysis is key to quickly get a picture of the overall test success and identifying critical test cases which require a drill-down analysis. AVL Scenario Simulator™ provides two levels of result analysis. Users can define Python-based post-processing scripts to calculate safety metrics based on the raw results data of each simulation case. The run overview shows all cases of a scenario parameter variation and color codes it automatically by the merged status of all safety metrics:
green: All safety metrics were passed successfully.
red: At least one safety metric exceeded the acceptance criteria.
The new parameter view provides even more information via 2D or 3D scatter plots of all cases of a run than it is recommended for example in the UN Regulation No 157 for Automated Lane Keeping Systems. The axes are variation parameters like lateral cut-in speed or cut-in distance and can be freely chosen by the user. This visualization allows to quickly grasp the performance of the automated vehicle in the context of the parameter variation and identifies critical parameter combinations. The user can switch the color scale between the status of the cases or single safety metrics (e.g., time-to-collision: 1.8s > 1.5s = passed) but also using the actual scalar values of the safety metric (e.g., time-to-collision: 1.8s). Scenario Simulator provides a real time job overview that combines the simulation job status and the post-processing results in one interactive dashboard. A click on one of the cases provides detailed information about parameters and safety metrics as well as simulation log and replay for detailed analysis.
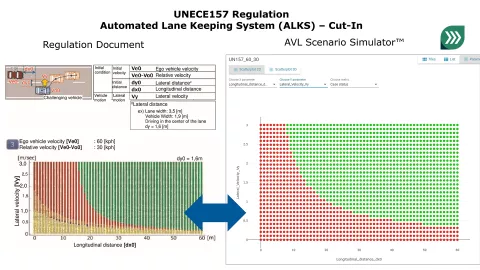

Scenario Simulator is a high-performance platform for running many tests on a notebook, workstation or cloud cluster. Its freemium licensing model makes it easy to get started and see what this tool can do for you.
If you are looking for a complete toolchain that also includes the design of new test scenarios as well as a company-wide management of scenarios and test plans and reporting, AVL SCENIUS™ is the solution for you. It is ISO26262 certified by TÜV Süd and thanks to open standards like ASAM OpenSCENARIO® and modular architecture fits seamlessly into any existing infrastructure. SCENIUS enables a traceable and reliable safety argumentation.
Many more Road Builder Templates and Support for Clothoids
The Road Builder Add-On for AVL Scenario Designer™ allows users to create complete road segments withing seconds and export them in ASAM OpenDRIVE® format. Each road segment exposes a set of parameters which allow users to easily create variants of the road (e.g. curvature, lane color, junction angle, traffic sign type, …).
The most recent version of Road Builder includes a new set of templates for road segments like junctions, roundabouts and parking. Curves can now be created using clothoids.
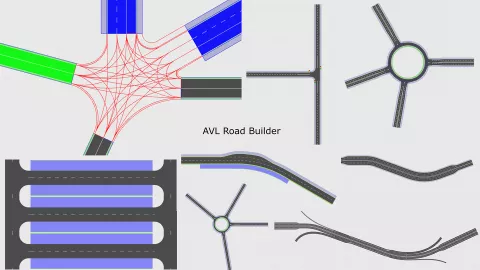

Creating new road segments with an editor can be a tiresome work. The Road Builder saves you a lot of time and work by providing relevant templates of road segments that are typically needed for virtual driving tests of ADAS/AD systems.
ISO26262 Certification by TÜV Sued
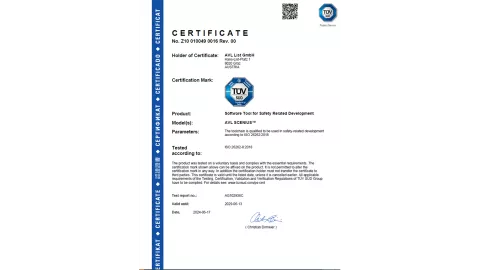
Scenario Designer as part of the SCENIUS toolchain has undergone rigorous testing and verification to ensure that the tool does not introduce or fail to detect errors or faults in the system under development. Customers benefit from reduced effort and cost to develop a compliant toolchain, enhanced credibility of the toolchain to prevent errors or faults, assurance of delivering safe systems into the automotive industry, and compliance with legal and regulatory standards for functional safety in road vehicles. This qualification ensures that the toolchain is reliable and meets the necessary safety standards, making it a trustworthy part of the validation process.

The new AVL VSM™ can connect steering and pedals to the VSM 3D viewer. The release also updates the vehicle importer tool for model conversion to VSM and new simulation post-processing options.
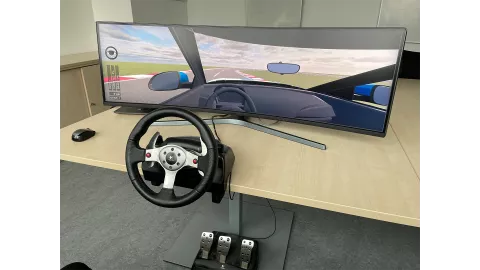
New AVL VSM™ Interface for Steering and Pedals Connection to VSM Viewer for DiL
VSM 2024 R2 introduces a new interface that connects various steering and pedal systems to the 3D viewer, enabling real-time model pre-testing and the initial stages of development, calibration and testing. The use of these systems (e.g. Logitech) supports testing activities in the office that require driver-in-the-loop consideration of test cases, without the need for a professional driving simulator.
VSM also supports professional driving simulators used in combination with various visualisation software commonly used in different phases of vehicle and controls development. The new feature adds the possibility of using basic systems directly connected to the PC or laptop where VSM is installed, allowing a human to control the vehicle model even in the office environment.
The different 3D tracks, vehicles and cockpits can be imported from 3D graphics software (e.g. Blender) and used in the VSM Viewer. In addition, VSM provides pre-defined 3D tracks and vehicles that can be used in combination with the VSM Viewer and the steering and pedal system, allowing users to immediately experience the benefits of the new solution.

New AVL VSM™ Simulation Post-processing Options
By using pre-defined graphs and plots for virtual test post-processing, VSM users can quickly analyse the results, make faster and better decisions and generate reports in minutes. With a focus on efficient post-processing methods, AVL has prepared a series of predefined examples that users can use immediately to analyze and compare their simulation results. These post-processing models can be customized to consider different analysis cases, allowing users to save time and costs when developing vehicle models and investigating different test cases.
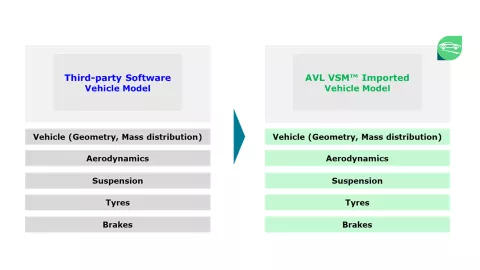

Updated AVL VSM™ Vehicle Importers for Model Conversion to VSM
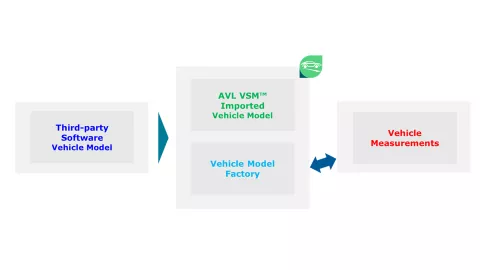
VSM 2024 R2 provides updates for third-party software vehicle importers, allowing users to convert multiple model parameterizations to VSM in an efficient process. The converted models can be further developed with Vehicle Model Factory using both vehicle measurement and simulation data as inputs, allowing users to automatically tune and correlate models (e.g. vehicle measurement vs. VSM simulation, or third-party software simulation results vs. VSM simulation).

Model.CONNECT™ and SiL testing support
Virtual Bus Component
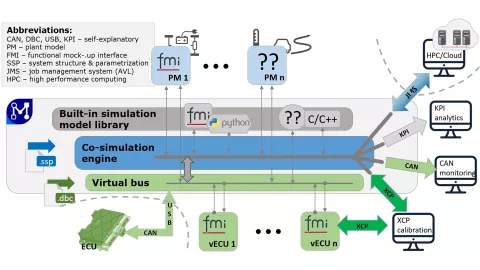
The Virtual Bus Component has been added to Model.CONNECT™, following the SDV (software defined vehicle) development demands for virtualization and automation of vehicle controls testing, and with intention to support the process efficiency of:
- the integration of virtual control units with a simulation plant model in a SiL (software-in-the-loop) testing environment
- the configuration of the control units’ signals
- the setting-up a continuous testing pipeline in a CI/CT/CD process (continuous integration/testing/deployment)
- an automated headless testing process with automatic variants and data management
The Virtual Bus Component simulates an ideal CAN-bus component and provides support for software developers, system integration and virtual testing engineers. The signals of the bus can be automatically read from a file (DBC – CAN database) or added manually. Each signal is represented as a port, which can be automatically or semi-automatically connected with the matching signals from the virtual control units or the simulation plant models. Such a port allows for one single signal writer, meaning it can only be connected to a single output port, ensuring the signal’s source consistency. However, multiple readers are allowed, so the port can be connected to arbitrarily many input ports.
In addition to the SiL integration environment Model.CONNECT, AVL provides the plant modelling tools AVL CRUISE™ M and AVL VSM™ (AVL vSUITE™, including a library of ready-to-use validated models), the vECU development and verification tool AVL MAESTRA™, as well as SiL test orchestration and data analysis with the AVL SiL Suite and AVL Data Analytics platform. SiL model set up with a virtual bus, virtual control units (vECU-s) and system simulation plant models can be used within DevOps methodology in different testing environments, from office HiL systems to purely virtual large-scale validation and testing systems in a cloud computing and HPC (high performance computing) environment.

Release 2024 R1
Release 2022 R2
- Virtual System Development - Concept, Layout and Integration
- Virtual Function Development - Automated and Connected Mobility
- Virtual Battery Development - From Cell to Vehicle
- Virtual Fuel Cell Development - Components and Systems
- Virtual Driveline Development - Transmission and E-Drive
- Virtual ICE Development - Durability and NVH
- Virtual ICE Development - Performance and Emissions
Stay tuned
Don't miss the Simulation blog series. Sign up today and stay informed!
Stay tuned for the Simulation Blog
Don't miss the Simulation blog series. Sign up today and stay informed!