Develop and Evaluate Solid Oxide Electrolyzer Systems Through Simulation
The development of complex systems such as a SOEC system is very challenging, not only because it is a rather new technology, but also because of other aspects, such as high temperature operation and very limited temperature gradients allowed in the stack. This was one of the main drivers to use AVL CRUISE™ M , a multidisciplinary system simulation software, at the center of the development. The software enables detailed electrochemical modeling of the stack and thermodynamic modeling of the BoP system, including pressure drop, heat transfer, chemical and vapor/liquid equilibrium calculations, all evaluated in 1D discretization.
SOC Stack and System Validation Examples
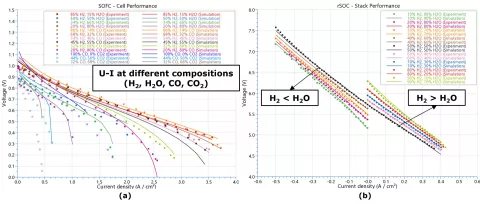
An important part of the software development is its validation. The native CRUISE M stack and BoP components were validated against the measurements extracted from the literature and/or internal AVL projects. The figure below shows validated stack examples either focusing on (a) SOFC operation on different fuel gas mixtures of H2, H2O, CO, and CO2 or (b) reversible SOC (rSOC) operation transition. The polarization curve results indicate a good agreement between measurements and simulation. Minor deviations occurred due to uncertainties in the cell and stack geometry, aging status, and operating conditions under which the experiments took place.
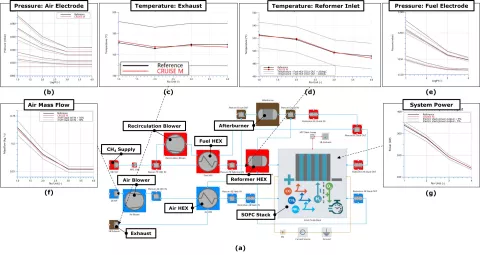
The figure below shows (a) a validated SOFC stack example integrated into a BoP system. The system is fuelled by CH4, and it is processed in an external reformer and internally in the stack. One part of the exhaust fuel is recirculated to increase the system efficiency and the other part is oxidized in an afterburner to reduce pollutants and reusing heat from the system. It is evident from the results that the simulation model accurately covers the behaviour of an actual system built at AVL as all important physical quantities were inside defined quality gates. The simulation results (red curves) are validated against reference data (black curves) and are shown for (b) air electrode pressure, (c) exhaust temperature, (d) reformer catalyst inlet temperature, (e) fuel electrode pressure, (f) air mass flow, and (g) system power.
A 1D Co-SOEC system model for syngas production was developed to analyse stack and system performance within various system design parameters.
Model Description
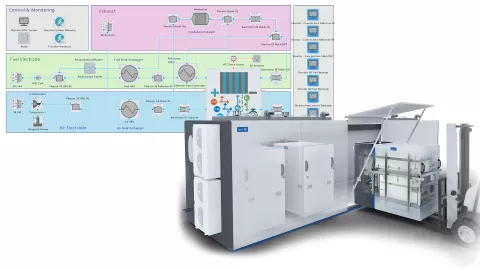
In the figure below, you see the architecture of the Co-SOEC system. This system represents a 100 kW electrolyzer system, with a steam to carbon ratio of 2.5 and fuel utilization and recirculation rates of around 75%. The stack operates between 770 °C and 850 °C, and the system achieves an efficiency of around 87.5% considering the lower heating value of hydrogen.
The air electrode path starts with a filter and compressor (1), pushing air through the system initially through heat exchangers (2), where it heats up to the desired temperature level. Heated air enters the stack (3), where oxygen is formed by the electrolysis process. At the outlet of the stack there is the first sequence of tail gas injection and oxidation catalyst (4), heating the air, which is transferring it further to the fuel electrode via the fuel heat exchanger (5). The second sequence of tail gas injection and oxidation catalyst follows (6), designed to heat up the air electrode side from air heat exchangers (7). One part of the process heat is transferred to the air flow, the other part to the steam and CO2 via heat exchangers (8). At the end, before the air exits the system, a throttle valve (9) regulates back pressure to ensure the desired pressure difference between air and fuel electrode.
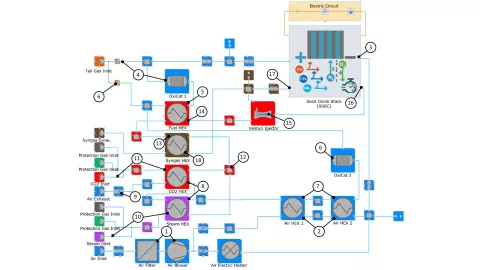
The fuel electrode path starts with the separate steam (10) and CO2 (11) supply with corresponding heat exchanger before the gases mix (12) and follow the path to the syngas heat exchanger (13). The path continues in the fuel heat exchanger (14) where the exact temperature is controlled. The mixed steam and CO2 are injected at high pressure into the venturi injector (15), where a significant amount of syngas is pulled back into the recirculation loop and directly into the stack inlet (16), which ensures higher purity of syngas on the stack outlet (17). The syngas is slightly cooled down in the heat exchanger (18), which brings some heat back into the system.
In addition to system architecture and component selection, there are also several actuators that need to be controlled in the right way for an efficiently designed system.
System controls in the presented model are:
- Mass flow of tail gas injection 1: For heating up the fuel electrode to the target inlet temperature.
- Mass flow of tail gas injection 2: For heating up the air electrode to the target inlet temperature.
- Air blower speed: Controlling the temperature difference of the stack to an acceptable temperature range and lower O2 limit in the air electrode.
- Electrical current through the stack: Used to control the load of the system.
- Fuel exhaust gas recirculation valve: Used to achieve the desired recirculation rate to reach target syngas composition while preventing fuel starvation.
- Back pressure valve: For regulation the pressure difference between both electrodes.
- Steam and CO2 mass flows: Should be regulated in the right ratios for the correct steam to carbon ratio and to keep the system at the required utilizations (stoichiometries).
The thermodynamic model was parameterized based on the supplier component datasheets for air blowers, heat exchangers, venturi injector and stack components. The controls were developed for base operation in order to evaluate system architecture performance and its behaviour at different ambient and operating conditions, which allows to investigate design changes, system optimization and trade-off between system costs and efficiency. The model can also be used for detailed control functions development and its calibration.
Use Cases of Simulation Models in the V-Process
The following figure visualizes the simulation capabilities of CRUISE M in a typical V-process, some of which have already been presented in the SOEC webinar and the SOFC webinar.
Here you can access the free of charge on-demand Webinars:
The following sections describe some of the use cases of the thermodynamic model and controls, including case study results and observations.
Architecture Variations
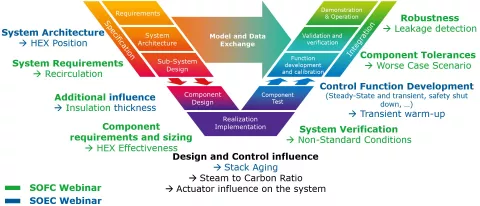
System architecture strongly determines the application and efficiency of the desired system. The figure below shows (a), (b) the comparison between two Co-SOEC system architecture variants. The original architecture is the same as Co-SOEC presented above, which was extended with additional heat exchanger integrated in the air electrode side (outlined by red colored connections). Results (c) indicate that an additional heat exchanger integrated in the correct place can be highly beneficial as it reduces exhaust temperature and enthalpy losses, resulting in an attractive system efficiency increase. It can provide additional benefits by reducing the maximum system temperature and allowing for potential system improvement using syngas heat recuperation. However, as the system gets larger, it can also have some drawbacks, such as higher pressure drops and heat losses.
System Insulation
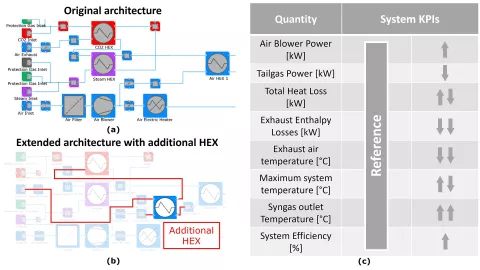
Heat losses occurring during system operation are closely related to component insulation, which in a Co-SOEC system, for example, must be compensated by the tail gas fuel, which directly affects the overall system efficiency. At least a thin layer of insulation is needed to keep the stack within the required temperature tolerance. However, there is always a trade-off between system cost (related to insulation thickness) and system efficiency, as presented in the figure below.
Air Blower Selection
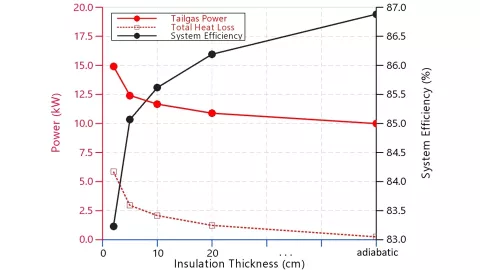
Component selection is one of the most typical system simulation tasks. When deciding to go towards highly efficient and high-cost components, it makes sense to investigate if the delivered performance it is worth the effort. Air blower efficiency will have a direct and indirect influence on the system efficiency. Lower efficiencies will result in higher blower outlet temperatures. This has two effects: first, it reduces the power required from the tail gas, and second, the higher temperature entering the cold side of the heat exchanger prevents efficient recuperation of hot gasses, resulting in higher exhaust enthalpy losses. Roughly 10% blower efficiency difference will result in 0.1% system efficiency as illustrated in the figure below.
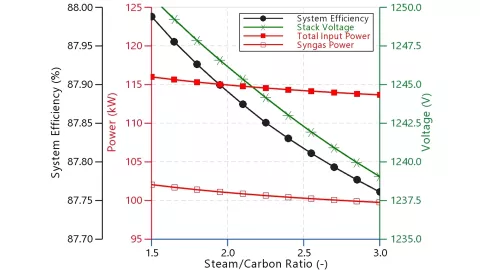
Steam to Carbon Ratio
The steam to carbon ratio in a typical Co-SOEC system is defined in advance to fulfil requirements of other processes, for example, target fuel production during Fischer-Tropsch synthesis. Besides gas composition, steam to carbon ratio also has other minor influences on system performance. As seen in the figure below, in general, cell voltage is slightly different, leading to lower required electrical power, providing the same reduction in syngas power, while keeping other powers similar (air blower power, heat losses, enthalpy losses), resulting in different system efficiencies.
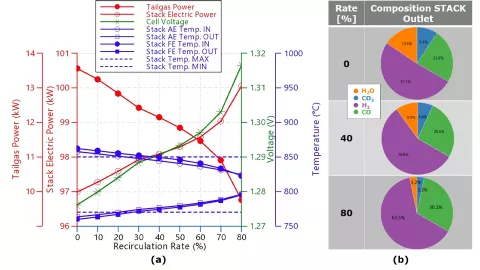
Fuel Exhaust Gas Recirculation Rate
Fuel exhaust gas recirculation rate is a countermeasure to fulfil system requirements in terms of syngas composition. The following figure shows that (b) the higher the recirculation rate, the higher the purity of the syngas produced (H2 and CO concentration), while still meeting the stack fuel utilization limit. The recirculation rate has other positive influences, for example, (a) it reduces the temperature gradient over the stack, which helps controlling the BoP. On the other hand, it increases the cell voltage, resulting a in higher electrical power demand for the electrolysis. In endothermic stack performance operation, this does not influence system efficiency, simply because less tail gas is required for similar temperature states.
Stack Aging
As the stack ages, its performance degrades, resulting in an increase in the required voltage for the same operation, which also results in a different temperature profile through the stack. System efficiency does not necessarily decrease with age because stacks are endothermic and additional heat is utilized in the system, whether it comes from the stack, or from other sources (tail gas injection). The main design task for aging is to properly control the system to keep the stack within the required temperature tolerances, in this analysis between 770 °C and 850 °C. This can be achieved by either air blower speed or/and electric current operation.
Current and blower speed control at different aging factors (aging modeled as a linearly scaled voltage increase) affect the temperature profiles through the stack, as can be seen in the figure below. One observation is that for smaller aging factors (up to 6 %) it is possible to achieve temperature tolerances with a single control change, while for higher aging factors, both measures should be applied simultaneously.
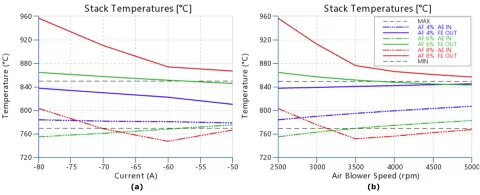
For this purpose, a design of experiments (DOE) was performed by varying the blower speed (between 3000 rpm and 6000 rpm) and current (between -80 A and -55 A) for a 10% aging factor (10% voltage increase compared to fresh stack operation). Stack temperatures at the inlets and outlets of both electrodes are shown in the figure below (a), (b), (c), (d). Black dots represent the design points, and the temperature color bar is defined to represent temperatures above the maximum of 850 °C (red), below the minimum of 770 °C (blue), and in the acceptable range (green). It can be observed that (d) fuel electrode outlet temperature was the most critical one as it covered the least amount of possible optimal operating points (6 points) and (e) operating point with air blower speed of 5000 rpm and current of -55 A resulted in the highest system efficiency of 80%.
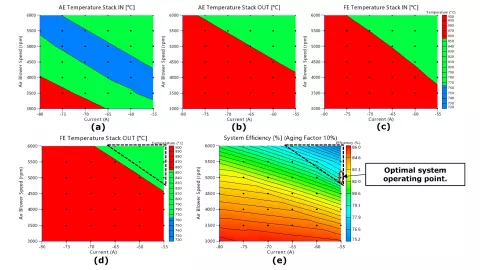
With combined current reduction and air blower speed increase it is possible to achieve plausible operation for a stack aging factor of 10 %. Th user can benefit from DOE or optimization to adopt the control strategy.
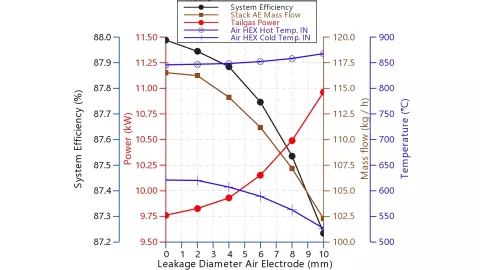
Air Feed Leakages
Leakages in the system might occur due to several operation factors and they influence the system efficiency as some portion of the heated gas is lost. This loss must be compensated for by an additional power source, such as tail gas injection. Ideally, leakages need to be detected in some way by the control unit, and simulation models can be used to develop and calibrate diagnostics for leakage detection. It is clear that there will be a reduction in mass flow due to leakage, which has two effects indicated in the figure below: an increase in the temperature of the exhaust gases (due to more tail gas power being put into a smaller mass flow) and lower temperature of the inlet gases (as less heat can be transferred from the exhaust gases to the inlet gases). This difference between the two temperatures could be a good indication that leakage is occurring in the system.
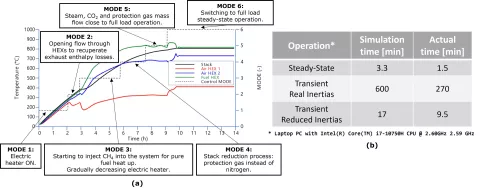
Control Functions Development
Using a virtual environment for control functions development and control unit calibration is a crucial step in accelerating activities earlier in the development phase, reducing costly testbed operations, and most importantly, avoiding damage to the actual system. Initially, basic controls were developed for steady-state operation. The development of transient system control, including warm-up, is particularly demanding, due to the long-term nature of the process. Several stack limitations have to be considered, the most important of which is the stack temperature gradient limitation, which results in a warm-up time up to 10 hours. Simulation plays a very important role, as it is faster than real time and provides thermal inertia reduction, giving the possibility to reduce the simulation from a 10 hour process to less than 20 minutes, as shown in the figure below.
In the past year, there has been a strong motivation to bring complex system modeling to engineers who are new to the topic and to provide experts with something useful in very short period of time. Our SOEC systems can be built with SOEC Generator, which automatically creates a model with all BOP components around the stack. The system is sized according to the information about active cell area and number of cells, and also offers automatic manipulation of modeling parameters to account for different insulation and heat exchanger effectiveness. It also offers pre-defined simulation dashboards with all important key performance indicators (KPIs) and thermodynamic quantities (mass flows, pressures, temperatures, composition) for instant model evaluation.
The simulation methodology and the 1D multidisciplinary system simulation software CRUISE M have been developed and validated according to measurements of the real use cases. The solid oxide stack and the gas path feature a real-time capable, multi-domain and multi-scale modeling approach, which considers all thermodynamic, chemical and electrochemical processes and, together with DoE and optimization capabilities provides a powerful combination for comprehensive system simulation. In the presented simulation study this was demonstrated by listing several use cases, starting with concept decisions (i.e., system architecture, insulation, component selection), continuing with operating strategies (i.e., fuel exhaust gas recirculation rate, stack aging, steam to carbon ratio), and ending with control function development (i.e., for leakage detection and transient warm-up). The latter tasks in particular have the highest potential for significant cost savings by replacing expensive testbed operations with virtual twins.
Learn More About This Topic

Electrolyzers – the technology at the heart of green hydrogen production – are currently in the focus of intense research and innovation activities, aiming at increased efficiency, minimized performance loss over time, and reducing development effort and time to market.
Solid oxide fuel cells are a promising technology for power generation within the context of renewable energy systems. This is mainly due to their high efficiency, fuel flexibility and environmental compatibility.
Aiming at a drastic CO₂ reduction in industry and mobility, the world is currently facing the challenge of producing green hydrogen at affordable prices and in sufficient quantities.